Seminar: Data Poetics (2014)
I See Songs
Cyrill Studer
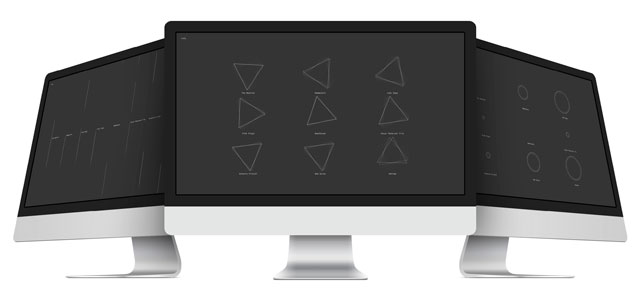
The subject of this project is to visualize meta-data of songs with a poetic approach. My intention was not to design an info-graphical solution from which one can extract exact values but rather to create an experience for the beholder where he can see certain parameters of songs from a different point of view. The outcome is a series of three Processing animations programs visualizing the danceability, the tempo and the energy of songs.
The data I use is provided by a company called The Echo Nest who analyzes digital music stored all over the internet and provides evaluated data for other companies like Spotify and Rdio for example and for non-commercial use like in this case.
Each of the three programs displays nine music artists. The song parameters are visualized based on the 100 most popular songs of this artist. By clicking an artist’s name the beholder can exchange it with another artist of his choice. Since the program is connected to the database of The Echo Nest it can load the data of the new artist and immediately update the visualization. When the cursor isn’t moved within a specific period of time the text fades out and the poetic aspect of the project becomes the focus of attention where you only see abstract animations.
I See Songs – Danceability This program visualizes the danceability of songs. The 100 most important songs of each artist are displayed to represent the character of an artist’s sound. The value of the danceability effects the intensity of the rotation of the triangle. Hence, the higher the danceability of a song is, the faster the triangle rotates.
I See Songs – Tempo This program visualizes the tempo of songs. The 100 most important songs of each artist are displayed to represent the character of an artist’s sound. The value of each song’s tempo effects the speed of the line representing this song. Hence, the higher the tempo of a song is, the faster the line moves.
I See Songs – Energy This program visualizes the energy of songs. The 100 most important songs of each artist are displayed to represent the character of an artist’s sound. The value of the energy effects the size to which the circle can increase. Hence, the higher the energy of a song is, the wider the circle becomes.


